Agentic AI systems require a fundamentally different approach to observability - one that captures reasoning traces, tool interactions, context retrieval, and model behavior across four distinct layers. This article provides a technical framework, enterprise scenarios, and tooling guidance for organizations building the operational foundation to deploy autonomous AI agents safely and reliably in production.
Date
March 24, 2026
Topic
Agentic AI
Share
A Technical Framework for Operating Autonomous Systems in the Enterprise
Agentic AI systems introduce a new class of operational complexity in enterprise environments. Unlike traditional deterministic software, AI agents reason, plan, and interact with tools dynamically. Their outputs are shaped by prompts, context retrieval, model behavior, and external APIs. This makes conventional application monitoring insufficient.
For AI practitioners and engineering leaders building agentic systems, observability becomes the foundation of reliability, governance, and operational safety. Without it, organizations are deploying systems they cannot debug, audit, or govern.
This article outlines a technical framework for observing, debugging, and governing AI agents in production environments - with concrete examples from enterprise scenarios where observability gaps create real operational risk.
Why This Matters Now
The scale of enterprise AI adoption has accelerated sharply, but production maturity remains rare. Most organizations are still in pilot phases, and the gap between experimentation and reliable production deployment often comes down to one thing: visibility into what the system is actually doing.
51% of organizations using AI experienced negative consequences from AI inaccuracy (McKinsey, 2025). 89% of organizations have implemented some form of observability for their agents (industry research, 2026). And 32% cite quality issues as their primary barrier to production AI deployment.
The consequences of operating without adequate observability are not theoretical. An airline’s customer service chatbot fabricated a bereavement fare policy that did not exist, resulting in a customer relying on that policy, taking the airline to court, and winning. A legal AI tool hallucinated case citations with fabricated quotes and case numbers, leading to sanctions against the attorney who submitted them. An AI coding agent asked to clear a cache ended up wiping an entire user’s drive because its “turbo mode” allowed execution without confirmation.
Each of these failures shares a common root cause: the organizations deploying these systems had no structured visibility into what the agent was reasoning, retrieving, or executing before it reached the end user.
The Observability Problem in Agentic Systems
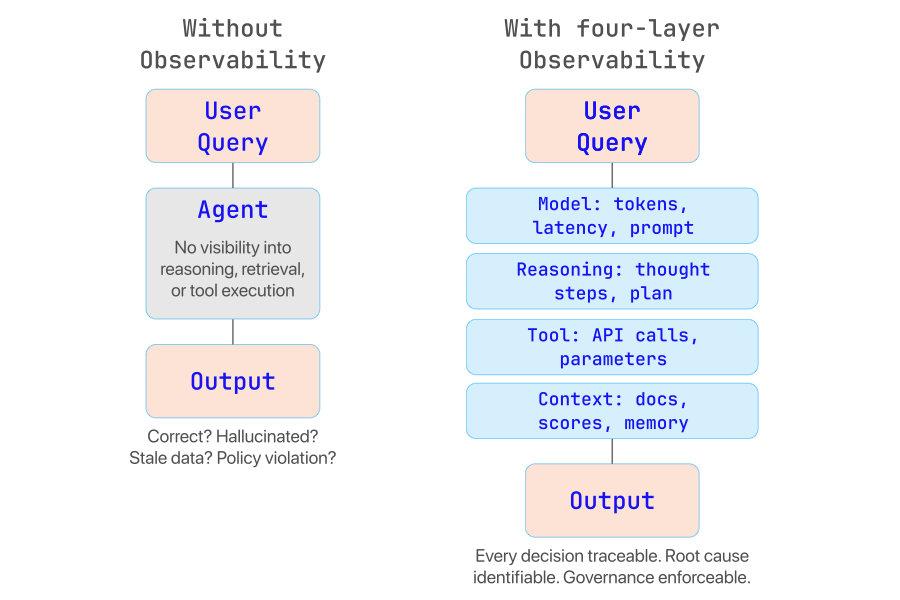
Traditional observability focuses on metrics such as request latency, system errors, and infrastructure health. These signals are necessary but insufficient for agent-based systems, because the core behavior of an agent occurs inside the reasoning loop of the model itself. A 200 OK HTTP response tells you the system is running. It tells you nothing about whether the agent retrieved the right documents, chose the right tool, or followed policy constraints in reaching its answer.
Enterprise AI systems must answer questions that conventional monitoring cannot address:
Why did the agent choose a specific action? Understanding reasoning paths is critical for debugging incorrect outcomes.
What context influenced the agent’s decision? Retrieved documents and memory often shape behavior in non-obvious ways.
Which tools were invoked, and with what parameters? Tool execution may introduce failures or security risks.
Did the agent follow policy constraints? Governance requires verification of guardrail compliance.
What caused hallucinations or incorrect results? Root-cause analysis requires traceability across the full reasoning chain.
A claims processing agent receives a patient inquiry about coverage for a specific procedure. It retrieves the patient’s plan documents via RAG, determines the procedure is covered under Section 4.2, and generates a response confirming coverage with a $50 copay. The patient proceeds with the procedure. But the agent retrieved an outdated version of the plan document - the copay was updated to $150 three months ago.
Without retrieval observability, the support team has no way to determine that the agent retrieved a stale document. The error looks like a model hallucination when in fact it is a retrieval pipeline failure. The distinction matters enormously for remediation: you do not fix a retrieval problem by changing your prompt.
The core risk: Without visibility into reasoning, retrieval, and tool execution, organizations operate AI agents as black boxes. Debugging becomes guesswork. Governance becomes impossible. And production deployment becomes an exercise in risk acceptance rather than risk management.
A Four-Layer Observability Model for AI Agents
A Four-Layer Observability Model for AI Agents
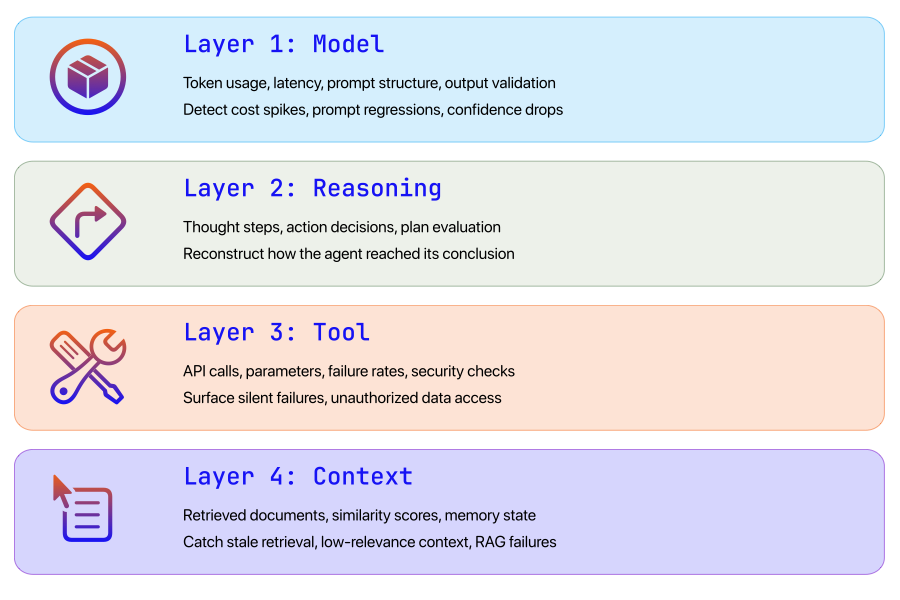
Enterprise AI observability requires a structured approach spanning the entire lifecycle of an agent interaction. We organize this into four layers, each capturing a distinct class of signals. Together, they form a full trace of the agent decision pipeline.
Model Layer - Monitor model behavior and responses. Key signals: token usage, latency, output confidence.
Reasoning Layer - Capture the chain of reasoning and planning steps. Key signals: intermediate reasoning traces, thought steps.
Tool Layer - Track interactions with external systems. Key signals: API calls, parameters, failure rates, security checks.
The first layer focuses on the behavior of the language model itself. Even when models appear deterministic, their outputs can vary based on prompt structure, context window content, and sampling parameters. Monitoring model interactions helps teams identify performance degradation, prompt regressions, and unexpected cost spikes.
Token usage - Tokens consumed per request. Operational value: cost monitoring and optimization.
Latency - Model response time. Operational value: performance tuning and SLA compliance.
Temperature and sampling parameters - Model randomness settings. Operational value: debugging unpredictable outputs.
Prompt structure - Full prompt sent to the model. Operational value: diagnosing prompt regressions.
Output validation - Structured output verification. Operational value: detecting hallucinations and format errors.
For large-scale deployments, token and latency monitoring are also essential for cost governance. Agent workflows can generate hundreds of model calls per task, and without token-level tracking, costs can spiral quickly - particularly when agents enter recursive loops.
A customer onboarding agent at a financial services firm handles document verification, compliance checks, and account provisioning. During a routine deployment update, the system prompt is modified to include additional compliance language. The change inadvertently pushes the prompt beyond the context window’s effective range, causing the model to drop critical instructions about required identity verification steps.
With model-level observability tracking prompt structure and token counts per request, the team detects that average token consumption jumped 40% after the deployment, and output validation scores for compliance-related fields dropped. Without this visibility, the team would not have connected the prompt change to the verification failures until customer complaints surfaced days later.
Layer 2: Reasoning Trace Observability
Agent systems typically perform iterative reasoning loops. Unlike a simple API call, an agent may plan multiple steps, evaluate intermediate results, change course, and retry actions before producing a final output. Observability must capture each of these steps in a reasoning trace - similar to distributed tracing in microservices architectures.
The typical agent reasoning loop follows this sequence:
Understand the task and decompose it into sub-goals
Plan actions and select appropriate tools
Execute tool calls and ingest results
Evaluate results against the original objective
Continue, retry, or finalize output
Reasoning traces allow engineering teams to reconstruct exactly how an agent reached a conclusion. In production environments, this data becomes critical for debugging unexpected behavior, validating agent policies, and auditing automated decisions.
A procurement agent is tasked with recommending the lowest-cost supplier for a bulk materials order. The agent queries three supplier APIs, receives pricing data, and recommends Supplier B at $42,000. But the operations team knows Supplier A quoted $38,000 in a recent call.
By examining the reasoning trace, the team discovers that the agent received a timeout error from Supplier A’s API, then silently moved on without logging the failure. The agent’s reasoning step shows: “Supplier A did not return results. Evaluating remaining suppliers.” It then selected the lowest price among the two remaining responses - which was correct given the data it had, but wrong given the full picture.
Without a reasoning trace, the team would see only the final recommendation and have no way to understand why the agent excluded the cheapest supplier.
Layer 3: Tool Interaction Observability
Agents rarely operate in isolation. Most enterprise systems use tools to interact with external platforms - databases, APIs, SaaS applications, internal microservices. This introduces additional operational and security risk. Research has shown that tool-calling hallucinations increase as the number of available tools grows: when agents have many similar tools, they exhibit function selection errors (calling non-existent tools) and function appropriateness errors (choosing semantically wrong tools).
Invocation frequency - How often the agent uses specific APIs.
Tool latency - Response time of external systems.
Parameter inspection - Inputs sent to tools and their validation status.
Failure rate - Errors, timeouts, and retries from APIs.
Security checks - Sensitive data exposure, unauthorized access attempts.
Enterprise Scenario: HR benefits inquiry agent
An employee-facing HR agent handles questions about benefits, PTO balances, and payroll. The agent has access to multiple tools: get_pto_balance, get_payroll_info, get_benefits_summary, and update_direct_deposit. An employee asks: “What is my current PTO balance?”
The agent correctly identifies get_pto_balance as the right tool. But the parameter it constructs includes the employee’s full Social Security number (pulled from conversation context) rather than the employee ID expected by the API. The API rejects the call with a generic 400 error, and the agent retries with modified parameters - this time including the SSN as a query string parameter in the URL.
With tool interaction observability logging both the request parameters and the response structure, the security team can flag this immediately: a sensitive data field was passed in plaintext, and the retry exposed it in URL parameters that may be logged by intermediate proxies. Without this layer, the incident goes undetected.
Layer 4: Context and Retrieval Observability
Many enterprise AI systems rely on retrieval-augmented generation (RAG). In these architectures, agents query knowledge stores before generating responses. The quality of retrieval directly determines the quality of the final answer - and in many cases, retrieval errors are the root cause of what looks like a model hallucination.
Query embeddings - Vector representation of the query.
Retrieved documents - Content used as context for generation.
Similarity scores - Relevance of retrieved information.
Chunk sources - Origin and version of the knowledge data.
Memory state - Long-term agent memory and conversation history.
Teams need to answer critical questions: Did the agent retrieve the correct documents? Was the knowledge base outdated? Did retrieval influence the final answer incorrectly? Was the chunking strategy appropriate for the query type?
Enterprise Scenario: Legal research agent in a regulatory compliance workflow
A compliance team uses an AI agent to research regulatory requirements for a new product launch in the EU. The agent queries a vector store containing regulatory documents, retrieves three chunks from GDPR-related regulations, and generates a summary of data handling requirements.
However, the retrieval pipeline returns chunks with similarity scores of 0.61, 0.58, and 0.54 - all below the typical relevance threshold of 0.70. The agent proceeds anyway, generating a response that combines fragments from unrelated regulatory sections into a coherent-sounding but misleading answer. The compliance team sees a well-structured, citation-rich response and assumes it is accurate.
With retrieval observability, the system would flag that all retrieved documents fell below the relevance threshold and that the chunks came from three different regulatory frameworks rather than a single coherent source. This signal alone would have triggered a human review before the response was acted upon.
Distributed Tracing for Agent Workflows
Modern AI systems resemble distributed systems composed of multiple services: language models, vector databases, orchestration frameworks, APIs, and data pipelines. Observability must therefore treat an agent workflow as a distributed trace - instrumenting each segment of the pipeline so engineers can visualize the entire lifecycle of a request from input to final output.
This is not a theoretical aspiration. The industry has been converging on concrete standards. OpenTelemetry has published semantic conventions specifically for generative AI agent observability, defining standardized attribute names for operations like invoke_agent, create_agent, and tool execution spans. These conventions provide a common schema for tracking prompts, model responses, token usage, tool calls, and provider metadata across any GenAI system.
The OpenTelemetry GenAI Semantic Conventions define span types for agent invocation (with distinct span kinds for remote vs. in-process agents), tool execution, retrieval operations, and evaluation results. Major platforms - including Datadog, which now natively supports these conventions - are building their AI observability capabilities around this standard. This matters because it means enterprises can instrument once using open standards and route telemetry to any compatible backend, rather than locking into vendor-specific SDKs.
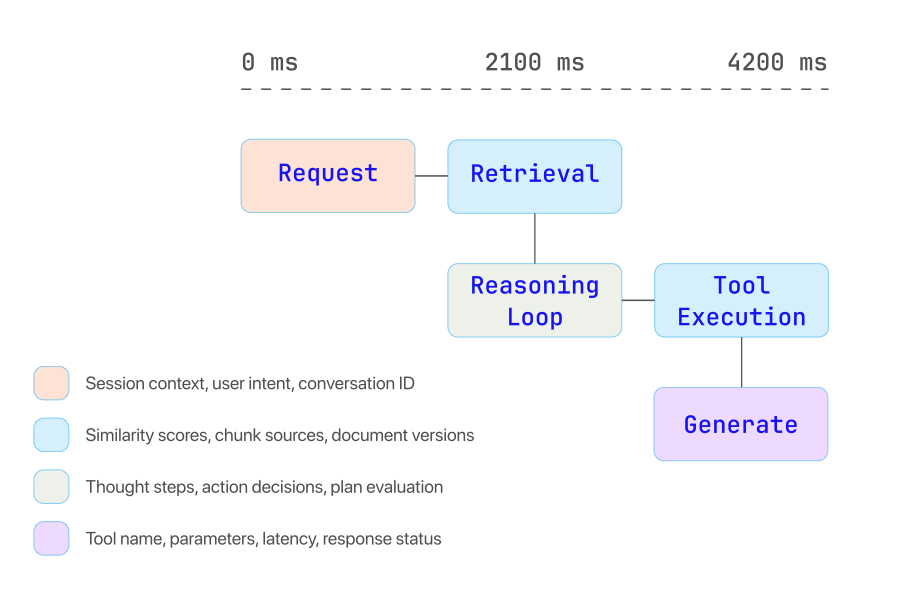
A typical distributed trace for an agent workflow includes the following segments:
Request ingestion - User query and session context. Key attributes: conversation ID, user context, session state.
Tool execution - API calls and external integrations. Key attributes: tool name, parameters, latency, response status.
Model generation - Final answer construction. Key attributes: model ID, token usage, temperature, output validation.
Enterprise Scenario: Customer service agent with multi-step resolution
A customer contacts an insurance company’s AI agent about a denied claim. The agent’s distributed trace reveals the following sequence: (1) user query is parsed and intent classified as “claim dispute,” (2) the retrieval pipeline pulls the customer’s claim record and the relevant policy section, (3) the reasoning loop determines it needs to check the claims adjudication rules, (4) a tool call to the claims API returns the denial reason code, (5) the agent generates a response explaining the denial and offering next steps.
The total trace takes 4.2 seconds. But drilling into the trace, the team discovers that 3.1 seconds are spent on the claims API call - a performance regression introduced by a recent backend deployment. Meanwhile, the retrieval pipeline returned the wrong policy section (auto insurance instead of homeowner’s), but the agent compensated by using its parametric knowledge - producing a response that was accurate in this case but would fail for edge cases.
Without the end-to-end trace, neither the API regression nor the retrieval error would have been detected. The response appeared correct and timely from the outside.
Evaluation and Feedback Loops
Observability is not only about monitoring live systems. It is also about measuring the quality of agent outputs over time and creating systematic feedback loops that drive continuous improvement.
Accuracy - Correctness of responses. Measurement approach: automated evaluation against known-good answers, spot-checking with domain experts.
Hallucination rate - Percentage of unsupported outputs. Measurement approach: specialized detection models (e.g., Galileo Luna-2), cross-referencing tool outputs against final responses.
Retrieval precision - Relevance of retrieved documents. Measurement approach: similarity score distribution analysis, retrieval-to-output attribution.
Task completion rate - Whether the agent completed the requested task. Measurement approach: end-to-end workflow success tracking, fallback and escalation rates.
Human review score - Feedback from human evaluators. Measurement approach: structured scoring rubrics, inter-rater reliability measurement.
The most effective evaluation strategies combine automated metrics with human review. Automated evaluators can run at scale across every interaction, flagging responses that fall below quality thresholds. Human review then targets the flagged subset, providing high-fidelity feedback that can be used to improve prompts, retrieval pipelines, or tool configurations.
Enterprise Scenario: Detecting a subtle regression in a customer support agent
A retail company deploys an AI agent for product returns. After a model update, the agent continues to handle most returns correctly. But the evaluation loop detects a shift: the hallucination rate for warranty-related questions has increased from 2% to 11%. The automated evaluator flags that the agent is now occasionally fabricating warranty extension terms that do not exist in the company’s policy database.
Without continuous evaluation, this regression would surface only through customer complaints - likely weeks later, after dozens of customers had received incorrect warranty information. With the feedback loop, the team catches the issue within hours and rolls back the model update while investigating the root cause.
Governance and Auditability
Enterprise deployments require the ability to audit AI decisions. This is especially true in regulated industries like financial services, healthcare, and insurance, where decision traceability is not optional - it is a legal requirement.
Observability systems must support immutable logs and trace records that answer four fundamental governance questions:
Decision traceability - Reasoning logs with full thought-chain capture. Example: reconstructing why a loan application was approved or denied.
Compliance audits - Stored interaction records with timestamps. Example: demonstrating HIPAA-compliant data handling in a patient-facing agent.
Policy enforcement - Guardrail monitoring and violation logging. Example: verifying that an agent never disclosed restricted pricing information.
Security analysis - Tool access logs with parameter-level detail. Example: detecting unauthorized access to sensitive employee records.
Prompt injection and security governance: Observability is also the primary defense against prompt injection attacks, where malicious inputs manipulate agent behavior to bypass intended constraints. Without tool access logging and reasoning trace analysis, organizations have no way to detect whether an agent has been compromised - or to determine the scope of the breach after the fact.
The Enterprise Observability Stack for AI Agents
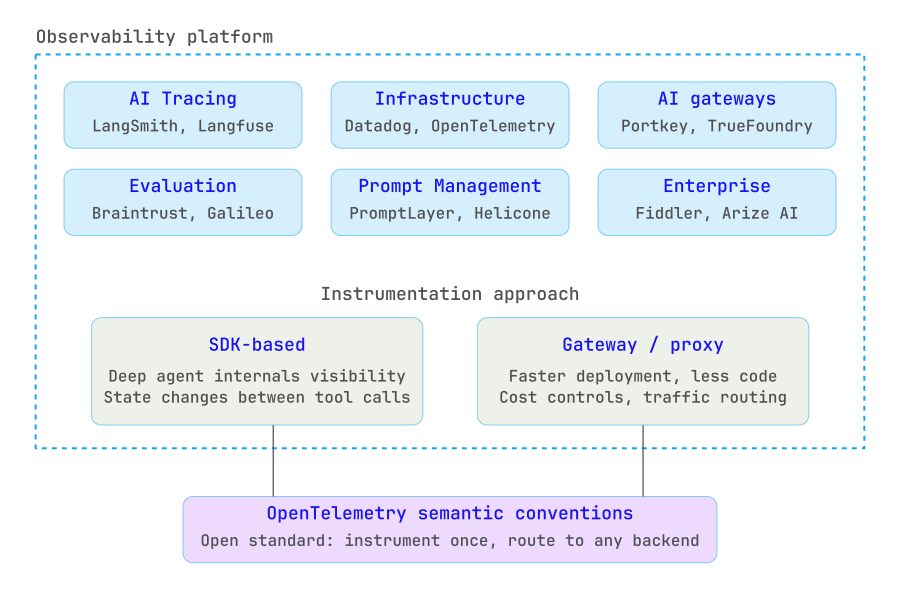
The ecosystem for AI observability has matured significantly. Platforms now range from open-source tracing libraries to enterprise-grade monitoring suites, and the trend is toward convergence with existing DevOps and MLOps pipelines. Organizations should evaluate tools across several dimensions: trace depth and granularity, integration with existing infrastructure, deployment flexibility (cloud vs. self-hosted), support for open standards like OpenTelemetry, and the ability to act on observability signals (not just display them).
A critical architectural decision is whether to instrument using an SDK-based approach or a proxy/gateway approach. SDK-based tools (Arize, Braintrust, Langfuse) give deep visibility into agent internals - including how state changed between tool calls. Gateway-based tools (Portkey, Helicone) offer faster deployment with less code change but may lack the granularity needed for complex multi-agent workflows. Most mature deployments use a combination of both.
Best Practices for Implementing Agent Observability
Organizations deploying agentic systems should follow several architectural principles to move from experimental prototypes to production-grade AI platforms:
Instrument every agent interaction - Capture reasoning traces for all requests, not just sampled ones. In early production, full-fidelity tracing is essential for understanding failure modes. Sampling can be introduced later as patterns are well understood.
Store prompts and responses - Enable debugging and regression testing across deployments. When a model update causes quality degradation, prompt-response logs are the primary diagnostic tool. Be mindful of data sensitivity: use redaction policies for PII before storage.
Track tool usage with parameter-level detail - Monitor not just which tools were called, but what data was passed to them and what was returned. This is essential for both security auditing and debugging silent failures.
Monitor retrieval pipelines independently - Do not treat RAG retrieval as a black box inside the agent. Track query-to-document relevance scores, monitor for stale content, and alert on retrieval quality degradation separately from generation quality.
Implement continuous evaluation loops - Deploy automated evaluators that score every response (or a statistically significant sample) against defined quality metrics. Route low-confidence responses to human review. Use the results to build regression test datasets.
Integrate with enterprise logging and alerting - AI observability should not exist in a silo. Connect agent traces to existing SIEM, incident management, and alerting infrastructure. An agent security violation should trigger the same incident response workflow as any other security event.
Adopt open standards early - Instrument using OpenTelemetry GenAI semantic conventions where possible. This avoids vendor lock-in and ensures telemetry data can be routed to different backends as the tooling landscape evolves.
The Cost Dimension: Observability as Financial Governance
Agent observability is not only an operational concern - it is a financial one. Agent workflows can generate hundreds of model calls per task, each consuming tokens that directly translate to compute costs. Without token-level tracking and cost attribution, organizations frequently discover that their AI systems are far more expensive than budgeted.
Enterprise Scenario: Recursive agent loop in a document processing workflow
A document processing agent is designed to extract structured data from contracts. When it encounters an ambiguous clause, it retries the extraction with a modified prompt. A bug in the retry logic causes the agent to enter a recursive loop, retrying the same extraction 47 times before hitting a timeout. Each retry consumes approximately 8,000 tokens.
The single document processing task, which should cost roughly $0.12, ends up consuming $5.64 in model calls. At scale across thousands of daily documents, this bug costs the organization over $4,000 per day before it is detected.
Token-level observability with per-task cost attribution would have flagged this anomaly within minutes. A simple alert on “cost per task exceeding 5x baseline” would have caught the recursive loop on its first occurrence.
The Future of AI Operations
The enterprise observability stack
As agentic systems become more autonomous, observability is evolving from a reactive troubleshooting function into what industry analysts are calling the “control plane” for AI operations. This represents a fundamental shift: observability data will not just tell you what happened, but will actively govern what agents are allowed to do next.
Several capabilities are emerging that will define this next phase:
Automated reasoning analysis - Systems that detect flawed reasoning patterns in real time, identifying when an agent’s logic chain has diverged from expected patterns before the final output is generated.
Policy enforcement engines - Observability-driven guardrails that can automatically block unsafe actions based on real-time trace analysis, not just static rules. For example, blocking a tool call if the reasoning trace indicates the agent misunderstood the user’s intent.
AI behavior analytics - Statistical models that establish behavioral baselines for agents and alert on anomalies: unusual tool selection patterns, unexpected reasoning path lengths, or shifts in output quality distributions.
Self-healing capabilities - Systems that use observability signals to automatically retry failed operations with corrected parameters, switch to fallback models when primary models degrade, or escalate to human review when confidence scores drop below thresholds.
Unified telemetry convergence - The merging of AI-specific observability with traditional application and infrastructure monitoring into a single telemetry plane. This removes the artificial distinction between “AI observability” and “application monitoring” and creates a unified view aligned with how end users actually experience the service.
By 2027, organizations that treat observability as strategic control infrastructure - rather than a debugging afterthought - will be the ones successfully operating autonomous AI systems at scale. Those that do not will face escalating costs, unpredictable behavior, and growing operational risk.
Conclusion
Observability is the foundation of safe and reliable agentic AI systems. Without visibility into reasoning, tool interactions, and context retrieval, organizations cannot operate autonomous agents with confidence. Every production failure we examined in this article - from fabricated policies to recursive cost spirals to silent retrieval errors - shares a common thread: the absence of structured observability that would have caught the problem before it reached the end user.
By implementing a structured observability framework across the model, reasoning, tool, and context layers, enterprises can transform AI agents from experimental prototypes into trusted production systems. The tooling exists. The standards are maturing. The question is no longer whether to invest in AI observability, but how quickly you can build the operational foundation that turns autonomous agents into reliable, governable business infrastructure.